Friday, April 9, 2010

Sharepoint recurring calender events filter

We are improving our processes using Sharepoint. On paper everything works well. In real life, its sometimes difficult.

I was trying to create a agendaview of the current week in Sharepoint. This wasn't supported default by sharepoint.

There is a workaround to fix it:
How To:
If there is a calendar, and you want to create a view where only events from today up to the next 60 days (or how many days out), here is how you do it:

  • Add a column to your calendar.
  • Name it “Date” and make it a calculated field.
  • Add “Start date” to the formula, and select “add date only”.

What this does is it creates a column that is filterable, because Start Date is not, and automatically populates the content of this column with the start date of the event.

  • Next, create a new view for the calendar, name it “Upcoming” (or whatever).
  • Select whatever fields you would like to display. If you are creating a view to show on another page, like the home page, and you just want a quick list of upcoming events, you might want to just have title and date fields display.
  • Under “Filter”, select: Date is less than or equal to[Today]+60andDate is greater than or equal to[Today]+60


http://designshare.wordpress.com/2007/11/02/filter-calendar-view/

This works for normal calendar events. But when using recurring events the start date defaults to the day the event was set to start. While the "Start Time" column displays the different dates as they progress, if you do the calculated field on "Start Time" it will only return the start time of the entire recurring event. So if you told the recurring event to start on 8/1/08, the Start Time may show 8/5/08 (today) but the calculated column will still show 8/1/08 regardless.

I did not find a fix yet!

http://abstractspaces.wordpress.com/2008/05/14/filter-list-view-by-current-week/

http://weblogs.asp.net/gunnarpeipman/archive/2007/10/09/filtering-sharepoint-calendar-by-start-time.aspx

Thursday, February 18, 2010

Performance counter registry hive consistency check has the status FAILED

While installing MS SQL Server 2008 r2 on windows 7, i got an error on one of the systemchecks:
  • Performance counter registry hive consistency check has the status FAILED
To fix it, i did the following:

Put this in any Console application:
  • string.Format("{0,3}", CultureInfo.InstalledUICulture.Parent.LCID.ToString("X")).Replace(" ", "0");
The write down the result. i.e. "016".

Go to the registry at this key:
  • HKEY_LOCAL_MACHINE\SOFTWARE\Microsoft\Windows NT\CurrentVersion\Perflib
Add the found value as entry. In this example:
  • HKEY_LOCAL_MACHINE\SOFTWARE\Microsoft\Windows NT\CurrentVersion\Perflib\016
Then copy the key's form the original entry to the new on.

Restart the setup, and you are ready to go!

http://social.msdn.microsoft.com/Forums/en-US/sqlsetupandupgrade/thread/dddf0349-557b-48c7-bf82-6bd1adb5c694?prof=required

Wednesday, February 17, 2010

How to Install SQL Server 2008 R2 (Express Edition) – November CTP

Installing SQL Server 2008 R2, i found the following interesting blog bij Petersad:

http://blogs.msdn.com/petersad/archive/2009/11/13/how-to-install-sql-server-2008-r2-express-edition-november-ctp.aspx

Overview:

With the release of the SQL Server 2008 R2 November CTP, we have simplified the SQL Server Express (all editions and package) installation process. In this release, we have completed the following:

  1. Reduced the number of clicks by 50% when performing an install.
  2. All inputs are defaulted on Vista and above operating systems. (many inputs are defaults on Windows XP and Windows 2003, except for the service accounts)
  3. Skip (auto advance) through the UI, meaning non-essential dialogs will still be skipped.
  4. Reduced the size of the Express basic package

For more detailed information on the SQL Server Express release, see: http://www.microsoft.com/downloads/details.aspx?FamilyID=c772467d-e45b-43e1-9208-2c7b663d7ad1&displaylang=en

The primary SQL Server Express downloads:


1. Launch the package, you will then see the contents extracted to a temporary location.

image

2. SQL Server Setup checks to determine pre-reqs are installed. If not, you will be prompted to install.

image

3. The Installation Center will then launch. Click on “New installation or add feature to an existing installation” to start the Installation Wizard.

image

4. Accept the license terms.

image

5. Review the features to installed and where SQL Server will be installed. Make any changes that are necessary for your environment.

image

6. Review the Instance Name and change if necessary.

image

7. Review the credentials that will be used for the services that will be created.

image

8. Review the Authentication Mode and the administrators that will be added to the Database Engine.

image

9. Review the Error Reporting settings. We encourage you to keep this option checked, as we review the product feedback on an ongoing basic. This helps us to continually improve SQL Server.

image

10. That’s it!

image

Support/Feedback

If you have further questions or feedback, you have a few options:

upgrading ms sql server 2008 to r2 FeatureUpgradeMatrixCheck

I was trying to upgrading ms sql server 2008 to r2, but got an error on FeatureUpgradeMatrixCheck.
The error was by design.
You can't upgrade a Real SKU to an Eval Sku. You need to look at the SKU matrix that is documented in BOL and determine which SKUs are valid to upgrade to and then provide an appropriate key. The keys are available on the download site.

https://connect.microsoft.com/SQLServer/feedback/details/349850/2008rc0-featureupgradematrixcheck-blocks-upgrade-of-ssas

Tuesday, January 26, 2010

Suppress Auto Update of MDX Parameter Datasets in Reporting Services 2008

With the MDX Query Designer in SSRS 2008 Report Designer and Report Builder 2.0, changing the main dataset overwrites the parameter datasets, which will kill any manual adjustments you’ve made. Bummer.
The hack to fix is to add a SuppressAutoUpdate =true to the parameter dataset. Right click the report and choose View Code. Find the dataset, and in the relevant node pertaining to your dataset, modify it. Then Save.

<Query>


<DataSourceName>DataSource1</DataSourceName>


<CommandText> …


<rd:SuppressAutoUpdate>true</rd:SuppressAutoUpdate>


<rd:Hidden>false</rd:Hidden>


</Query>


I found this solution here:
Suppress Auto Update of MDX Parameter Datasets in Reporting Services 2008

Thursday, January 21, 2010

Changing all-name in dimension

When working with cubes and dimensions and you have a dimension with time for example, you have the value "All" default added. "All"means that you select all occurrences in the time dimension, selecting the measures over all time.

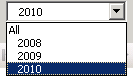
When you create reports using cubes, this all-value is default added to the report as well. So when you create a parameter, "All" is included in the dropdownbox:


To support your users, "all" is not the best discription that can be added. A better option would be "all time", or "last 5 year" (depending on the horizon of your dimension).

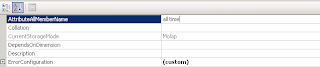
To change this default behavour, go to your cubedesgin and go to the properties of your dimension. Then change the field AttributeAllMemberName to the disired name:


Leaving it blank will default add "all". Changing the property will add your given name as all-value.

Executing jobs with SQL

When you work with a scheduling tool outside MS SQL, it can be handy to execute jobs using this external tool. If its a trigger or a scheduled time, it's always important keeping your processes together in one place to maintain overview. So if you need to execute jobs you can use the following:

CREATE PROCEDURE refresh_cubes AS
EXEC msdb.dbo.sp_start_job @job_name = 'refresh_cubes'
GO

http://www.dbforums.com/microsoft-sql-server/927352-how-start-dts-job.html

Wednesday, January 20, 2010

How to automatic process SSAS Cubes

After building a cube in SSAS and its released for production, its time to automate the processing. Unless you like pushed the same button every monday ;)

To create an automatic scheduling, you have two options:
  • Using SSIS
  • Using XML script

SSIS
Using the integrated services methode, we first need to create an integrated services project. After that, we need to create a connection to our AS database.


Then add an analysis services processing task. This a default task to process your cubes and dimensions.


Now pay attention: Process your dimensions first, else you could end up with key conflicts. The task doesn't process automaticly the dimensions first and then the cube. It does this in random order.

This means you have to add a second analysis services processing task. The first one only for the dimensions, and the secondone for the cube:


Now build the project and add it to your sql agent as a job.

XML scripts
The script method is pretty easy, but less flexible. Go to the database you want processed. Rightclick and select process. Then in the topleftcorner you see an option script to clipboard.


Then create a job in the agent and add a step SSAS command. Add your ssas servername and paste the xml script into the editbox.

Schedule and save the step and your done.

Monday, November 16, 2009

SSRS 2008 deployed on sharepoint BI gives a drilldown error (rsItemNotFound)

We created various reports with drilldown functionality on SSRS. This worked great and we assumed it would work the same way on Sharepoint.

So we deployed the reports, but we discovered after some testing that the drill down functionality didn't work anymore. It displayed the error: The item 'http://oursharepoint.nl/reports/reportslibrary/report1' cannot be found. (rsItemNotFound)

While researching this error, we came to the conclusion that default the underlaying report is accessed without extension. SSRS knows which report need to be called, automatically filling in the RDL extension. Sharepoint, on the other hand doesn't know . There are multiple types of reports and therefor it doesn't automatically knows which extension it needs to use.

Summarizing: SSRS just needs the name, Sarepoint expects an name and extension.

So we could build the report in such manner that it works with sharepoint, but then i wouldn't work with SSRS anymore. So we need another way. To fix this, try the following:

• Open the report in Visual Studio

• Go to the link which provides the drilldown

• Open the properties


• Go to actions

• Edit the expression, which calls the report


• Finally add the following expression: IIF(Globals!ReportServerUrl Like "*http*", "report1.rdl", "report1")


Using the Globals!ReportServerUrl we can determine if the url is a http protocol or not. If so, its called by Sharepoint and we need the extension (report1.rdl), if not, it's called by Visual Studio and we don't need the extension (report1).


Now the reports opens if its called in Sharepoint or in SSRS.


http://social.msdn.microsoft.com/Forums/en-US/sqlreportingservices/thread/002ccd0b-a850-4c5f-8904-38ac5bcbe5c3/

Update:

The error is caused when the underlaying report is called using an expression. If you point straight to a report without expression, it works fine on Sharepoint or SSRS. But when you use an expression to determine which report needs to open, it needs the extension and the workaround above still solves the problem.


Wednesday, November 11, 2009

NULLIF() to prevent divide by zero errors in SQL

We encountered problems trying to dividing tru zero. We tried to select a duration in day's and the amount of visits, to calculate the avarage staying periode. When a customer stays shorter than one day, 0 is registerd, resulting in a 0 divided by 0, which obvious results in error.

i.e.
Duration = 5
Amount = 0
Select (5/0) gives an error.

We could write an case statement to prevent this, but there is an easier way: NULLIF!

NULLIF() takes two arguments and returns NULL, if the two values are the same. This can be used to turn the divisor from a zero into a NULL, which will force the entire equation to become NULL.

Duration = 5
Amount = 0
SELECT
( Duration / NULLIF( 0, Amount ) ) = ( 5 / NULLIF( 0, 0 ) )

This statement returns NULL and can be very helpful when working with aggregate or calculated values.


Informatica 9 Released

Integration platform includes common metadata core, tools for business end users and IT collaboration, SOA-based data services
Information Management Online, November 10, 2009

Enterprise software provider Informatica today released the latest version of its integration software platform, Informatica 9.

Informatica 9 builds on previous releases that included a common platform and version control that allows teams to work across time zones. The 9 release layers on some browser-based tools and a common metadata layer that allows standardizing policies and data quality rules.

The vendor breaks the release into six categories: enterprise data integration, data quality, B2B data exchange, application information lifecycle management, complex event processing and cloud computing data integration.

The message however, centers around three themes intended to push data integration from the back office to the front: SOA-based data services, "pervasive" data quality and business/IT collaboration.

Ash Kulkarni, VP of product management at Informatica, says companies need to think in terms of a data layer in infrastructure that isolates underlying systems from the applications that use them. "When we went down the path of SOA, we were all thinking about applications, but at the end of the day it is fundamentally about exchanging data," he says. "It needs to be your data at the right time over any protocol, Web service, SQL, batch, whatever." With a core metadata layer, Informatica says companies can use universal data discovery services to profile and investigate information and policy-based data services to manage governance and user access to sensitive data.

The second theme, pervasive data quality, revolves around building data quality rules once and applying them across all domains. This enables all stakeholders to participate in the process of driving data quality across the organization through browser-based tools for business analysts and data stewards that can provide tighter collaboration with IT.

The use of these tools is really the premise to the third theme of the release, business-IT collaboration. "You want to get away from the old process of requests to IT and designs and modifications and instead work on exactly the same thing from different perspectives through an underlying metadata layer," says according to Chris Boorman, chief marketing officer at Informatica. In this way, he says, the specification becomes the design of an integration request.

The new platform gives Informatica more exposure to the business side during the sales cycle. Forrester Research analyst Rob Karel says this is likely to become a trend among data quality and master data management vendors that recognize that IT-only projects usually have a low return and a higher risk of failure. "Just getting the business engaged as part of the process of defining and rolling out these data quality capabilities is really the key to success," Karel says. "That's why governance is a hot topic right now."

Nonetheless, Informatica 9 is a technology solution to a business problem, and the heavy lifting of organizational culture and change management is in getting business users to assume more responsibility and accountability for data quality. Analysts agree that placing collaborative tools into the right hands is a step in the right direction, but does not resolve weak and slow adoption of governance practices.

IDC research vice president Carl Olofson says the more likely it is that the business understands exposure to poor data quality, the more likely it will embrace and become involved in projects to improve performance. "The actual operations still need to be in the hand of a data professional, but when an executive can look at and understand the present state of play and exposure, that's important."

Mark Smith, EVP at Ventana Research worked his way through the details of Informatica 9 and says what he found is a clear step in the right direction. "The capabilities are pretty simple and straightforward, and for those analysts who want to do some data modeling and go beyond data quality, it works well." Early customer involvement, going back to alpha testing in May, helped this result, Smith said.

But Smith adds that the key challenge will be to get analysts to work together, and more collaboratively to further the goals of data governance. "Bad habits don't die easily."

Given this state, Karel says it was a smart idea for Informatica to build the product before widespread demand arrives. "There is a lot of IT demand to push the business to take more accountability but our research finds data governance maturity extremely low on the business side," he says. "I think it's a good thing that they are providing tools to help internal evangelists make it happen a little better."

Boorman hopes the old back-office view of Informatica is fading and that data quality is a fundamental area where his company can engage more actively with the business. "This is all about timely, trustworthy and relevant data for the business." The company plans an introduction and demonstration of the software for today, and Boorman says that more than 11,000 people have registered for the event.


http://www.information-management.com/news/data_integration_soa_service_oriented_architecture-10016496-1.html


Wednesday, October 28, 2009

Two more video's of Excel Gemini

Two more video's of Excel Gemini. It looks cool. The key is the enormous fast calculations and orderings. This is done using ”in memory cubes”. It is impressive, but keep in mind that other competitors like Cognos, already have this feature. Not for excel do.


Thursday, October 22, 2009

Wrox Professional Microsoft Sharepoint 2007 reporting with SQL sever 2008 reporting services review

I'am currently working on a Microsoft Sharepoint business intelligence project.

To prepare for the project I read the book Wrox Professional Microsoft Sharepoint 2007 reporting with SQL sever 2008 reporting services.

What a disappointment that was! Do not read or buy the book, if you are a tiny bit familiar with reporting and deploying. I really thought it would go in-depth, combining Microsoft Sharepoint and business intelligence. Talking about structure, function, enc. But that’s not the case.

The first 9 chapters is about creating reports and deploying. Chapter 10 is about some overrated and complex AJAX solution to deploy and display your reports. Chapter 11 is about gauges. Very short and obvious.

Off course everybody needs a basic understanding and every organizational needs are different, but there is an certain essential that is missed.

Deployment is very imported, but not worth 3 chapters. Especially not when your pretty new to this, and that’s the books audience. You want to know how to create a fast, efficient and good solution for the end-users.

Summarizing:
If you want to know more about deployment and care less about how the reports are shown and interact, this book is for you (although is pretty expensive for what you get). If not, please find another book. There are much better books out there.

http://www.wrox.com/WileyCDA/WroxTitle/Professional-Microsoft-SharePoint-2007-Reporting-with-SQL-Server-2008-Reporting-Services.productCd-0470481897.html


Professional Microsoft SharePoint 2007 Reporting with SQL Server 2008 Reporting Services
Coskun Cavusoglu, Jacob J. Sanford, Reza Alirezaei
ISBN: 978-0-470-48189-9
Paperback
480 pages
September 2009

Monday, October 19, 2009

Setting target audience in Sharepoint using Active directory

I'am currently working on a Microsoft Sharepoint BI project. It's a rough road, but we are getting there. The base foundation for Microsoft Sharepoint users and security is Active directory.


What I tried to accomplish is a portal page with three main parts:

- Dynamic reports, showing only those reports relevant, depending on the usertype;

- A main KPI about the topic;

- Key figures about the topic.


As said, I want to create the reports dynamically. This is for two reasons:

1. For more effective transaction and interaction with the enduser;

2. For security reasons.


i.e I have 2 types of users:

Managers;

Operational employes.


Both usertypes need to see different reports. The employe wants to know if the have enough supplies left and the type of orders.


The manager on the other hand wants to know if his department is meeting the organizational goals. He want information about salaries, costs, enc. The manager does not need to know the order details, cause it isn't relevant to his job and the employe doesn't need to see the main salaries for security reasons.


So I created these two active directory groups and added the users. I created the same group in Microsoft Sharepoint.


The next step is adding a report to a webpart and set the target audience to the appropriate group.


But there things went wrong. Altho it sounds doable, Microsoft Sharepoint doesn’t allow Active directory groups in a Sharepoint group to be assigned to a target audience. It could cause performance issues.


There is a second but: I’am not happy having to create an Active directory group and then the SAME Sharepoint group for management reasons.


...but there is hope. For my first concern, there is a hotfix available:


SYMPTOMS

You add Active Directory user accounts and Active Directory group accounts to a group in Microsoft Office SharePoint Server 2007. When you designate the SharePoint group as the target audience for a specific Web Part, some user accounts in the SharePoint group cannot access the Web Part.


CAUSE

This behavior occurs because only individual user accounts that are assigned to the SharePoint group are recognized as the target audience. Only those individual user accounts can access the Web Part. However, when you add an Active Directory group account, the users in the group account are not recognized as part of the target audience. Therefore, user accounts that reside in a group account that has been added to the SharePoint group cannot access the Web Part.


RESOLUTION

To resolve this issue, apply the hotfix package that is described in the following Microsoft Knowledge Base article:

942819 (http://support.microsoft.com/kb/942819/ ) Description of the SharePoint Server 2007 post-Service Pack 1 hotfix package: January 31, 2008

Back to the top


http://blog.tomaselfving.com/2007/12/moss-audiences-with-sharepoint-groups.html

http://support.microsoft.com/default.aspx?scid=kb;en-us;948681


Hotfix

http://support.microsoft.com/kb/942819/


Thursday, October 15, 2009

QlikView on Your iPhone

One of the most fun tools i came a cross to work with is Qlikview for sure. It is very innovative and playful. Now the brought business intelligence to the iphone.

I will write a full review after i finnish with wabit!

http://www.qlikview.com/

QlikView for iPhone delivers the first, truly interactive, mobile BI app built specifically for the iPhone and iPod Touch. It fully leverages iPhone’s native multitouch and GPS features, resulting in a groundbreaking app that puts the power of QlikView’s sophisticated real-time business answers in the hands of iPhone users.

First industry reviews

QlikView on Your iPhoneFirst looks of QlikView for iPhone by independent reviewers have been, to say the least, very favorable: “I found it to be very quick and easy… All in all, this looks like a great tool for those who want real-time access to their business intelligence data and want to use their iPhone to get to it,” reports Daniel Green on Macworld.com. Another review on Axis Group BI Commonsnoted how QlikView for iPhone “is considerably faster and with better functionality than navigating the AJAX versions of QVWs in the Safari mobile browser.”

Download free from Apple iTunes Store

QlikView for iPhone can be downloaded for free from Apple’s Mobile App Store on iTunes. If you’re not a QlikView user and haven’t access to a QlikView server, you can use the default to QlikTech’s public demo server to experience QlikView on your iPhone with one of our demo apps.

Test with your own data

If you’re not a QlikView user and haven’t access to a QlikView server, but want to try QlikView for iPhone with your own documents:

  1. Install IIS on your machine
  2. Download your Personal Edition of QlikView (Version 8.5 + or higher including the Zero Footprint Client)
  3. Download and install the QlikView for iPhone app via iTunes.
  4. Start the app, and choose "Edit" on the first screen.
  5. Add details for accessing your QlikView Server.

If you are a QlikView user and have access to a QlikView server, just follow steps 3 to 5 above.

FAQs

  1. I don’t want my data/user credentials sent across the web unencrypted. Is encryption/security supported?
    Yes. Just set up a VPN to access your server. (see Apple Knowledgebase article on setting up a VPN on your iPhone or iPod Touch)
  2. What license arrangements do I need in order for multiple users to take advantage of QlikView for iPhone with our own server?
    The iPhone client uses a standard user CAL (Client Access License).

Tuesday, October 13, 2009

Importing and exporting in Informatica Powercenter

When you work with Informatica Powercenter you probably have a development and production repository. This means you will have to transfer workflows form one repository to the other. You can use the copy function, but that doesn't work very well.


Instead you can use the import and export function. This works pretty good, but be sure to use the import and export function in the repository manager. The XML created by the repository manager is far more extended then the one in the workflowmanager.


But its not all milk and cookies.I often noticed that after importing my connections where gone. Second, the folders for the sources in the development repository are different then the folders in the production repository (i.e. for management reasons). I my case, we had less folders in the production repository so we had to fit some sources to different folders. This was a bit tricky.


I used the following trick to speedup the process:

  • Edit the XML using a good editor.
  • Find the connectionstring and alter it to the correct production stringname.
  • Find the foldernames and alter those to the correct production foldername.
  • Safe the XML and start your import again.


i.e.

Bronnen" DESCRIPTION ="" NAME ="Products" OBJECTVERSION ="1" OWNERNAME ="rd" VERSIONNUMBER ="1">

Bronnen" description="" name="Products" objectversion="1" ownername="rd" versionnumber="1">


Keeping track of table structures, its all in the name!

When developing table structures for datawarhousing, datamarts or any other purpose where you need an relational data model, it is often that we lose track of the combinations that are made. Especially when the number of tables in our database grows. To manage this problem we must pay attention naming the tables, views, cubes, etc.

First give your table the name of the project you are working on. For example: I am working on a product database project where I manage my production. I start with prefix prd_ or even better, I create a scheme called "Production". Then I describe the table purpose and the data it contains. In the productcase i'm loading data about products to my datawarehouse (DWH), so I use the following name: "Production.Product".

My attributes get similar names using short prefix which identifies the attribute.

Last I identify my foreign key and give it the name of the foreign table and then the name, so when I’m in a visual program working with the data, I still know which relations there are. Also it improves the management of the database and its applications. See the following example:

CREATE TABLE [Production].[DWH_Product](

[pk_Product_ID] [int] IDENTITY(1,1) NOT NULL,

[Product_Name] [dbo].[Name] NOT NULL,

[Product_Number] [nvarchar](25) NOT NULL,

[Product_SubcategoryID] [int] NULL,

[Product_ModifiedDate] [datetime] NOT NULL

)

CREATE TABLE [Production].[DHW_Productcategory](

[pk_ProductSubcategory_ID] [int] IDENTITY(1,1) NOT NULL,

[fk_DWH_Product_ProductID] [int] NOT NULL,

[Productcategory_Name] [dbo].[Name] NOT NULL,

[Productcategory_ModifiedDate] [datetime] NOT NULL

)

Monday, October 12, 2009

Wabit: The Ultimate BI Reporting Tool for Mac

After seeing the Microsoft video earlier to day, and knowing that it Microsoft has some pretty good BI-products, I was wondering if there where any Apple based BI-products. Maybe only as reporting, query or ETL based. So i went online and found my first toy: Wabit. I looks fun, and I’am going to test it tomorrow. I will post a review later this week about

Wabit

Wabit
is an elegant and easy to use Business Intelligence Reporting tool. It offers database and business users the ability to perform Ad-Hoc Queries and generate Standard Reports.

The Wabit is designed to be the most intuitive and simplest BI Reporting tool on the market. It includes creative features such as a drag-&-drop playpen, live result-set updates, global searching, and WYSIWYG report formatting.

The Wabit also makes Standard Reporting easy. With a single mouse click, query results are instantly transformed into elegant reports that can be further customized with fonts, colours, sections, breaks, headers, footers, logos, and more.

It offers technical and business users the ability to:

  • Drag-&-Drop source database tables into a playpen
  • Use the database definitions to automatically formulate required joins
  • Intuitively refine your queries with an “evolving” result set that updates instantly and continuously
  • Many more features